
|

|

|

|
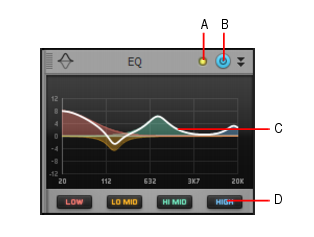
Figure 261. Curve EQ module.A. Clipping LED B. Curve EQ enable/disable C. Graph D. Band enable/disable (Low, Low-Mid, Mid-High, High)

, Low-Mid
, Mid-High
and High
bands. Enabling a band allows it to be processed with equalization. The knobs and graph curves are color-coded per band:
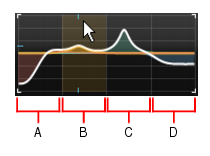
Figure 262. Curve EQ graph.
Tip - Searching Documentation
Tip: To search for a specific topic, type your search query in the Search Cakewalk.com field at the top right of this page.
When the search results appear, click which product's documentation you would like to search to filter the search results further.
Note - Using Offline Help
Note: If you prefer to always use offline Help, go to Edit > Preferences > File > Advanced in your Cakewalk software and select Always Use Offline Help.
If you are not connected to the internet, your Cakewalk software will default to showing offline help until an internet connection becomes available.